How Website Speed and Revenue Are Directly Linked
Website speed and revenue are tightly linked. See the data, the metrics that matter, and how to prove the connection on your own store.
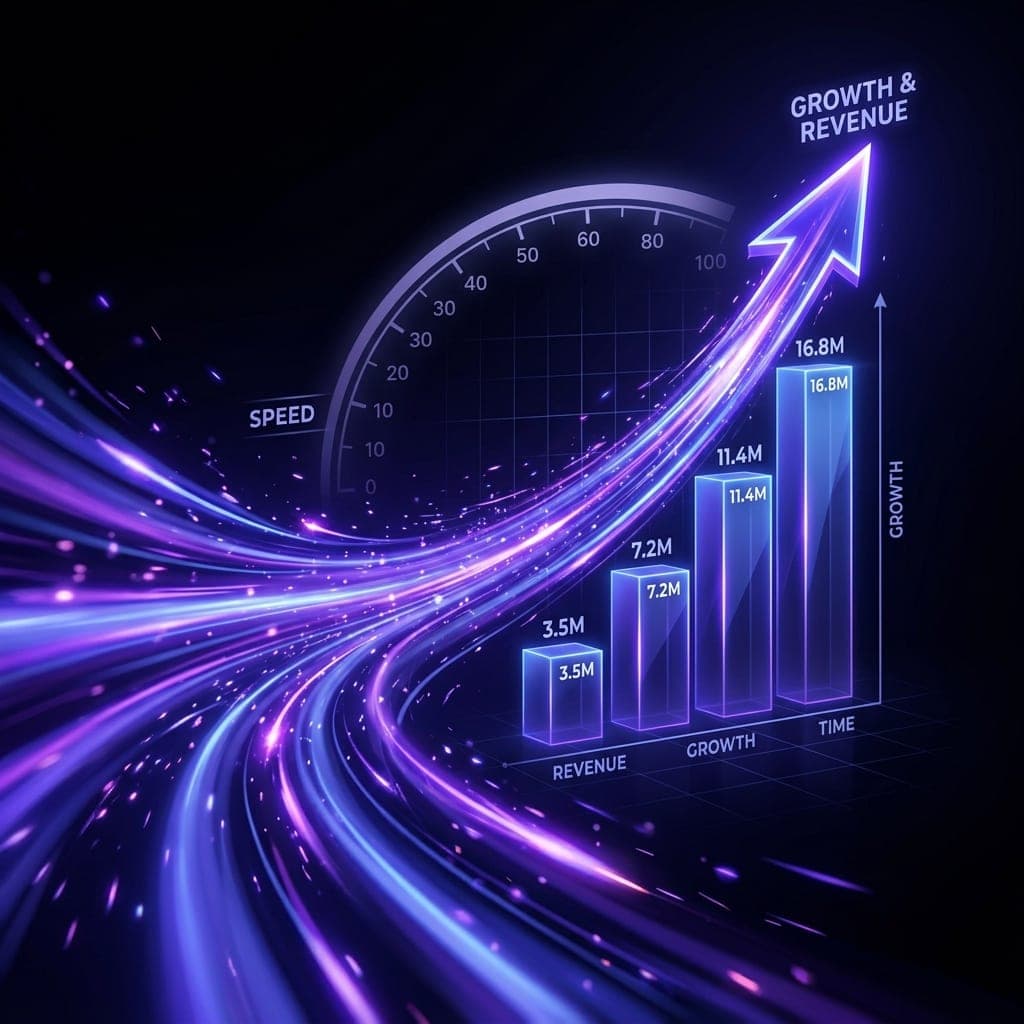
Most teams treat performance as an engineering nicety, something to clean up after the features ship. That framing is expensive. The link between website speed and revenue is not a soft correlation you can wave away in a planning meeting. It is one of the most consistently measured relationships in ecommerce, and it shows up in the same direction across retail, media, SaaS, and lead generation. A page that loads in one second converts far better than the same page loading in five, and the money left on the table compounds every single day the site stays slow.
This post walks through what the data actually says, why speed changes buying behavior, how to measure the connection on your own site, and where the biggest bottlenecks usually hide.
Website Speed and Revenue: What the Data Actually Shows
The numbers have been remarkably stable for over a decade. When large companies run controlled experiments on load time, the revenue impact is immediate and measurable.
| Company or study | Finding |
|---|---|
| Amazon | Every 100ms of added latency cost roughly 1% in sales |
| Walmart | Every 1 second of load time improvement lifted conversions by 2% |
| Deloitte retail study | A 0.1 second improvement raised retail conversions by 8.4% |
| Google mobile research | 53% of mobile visits are abandoned if a page takes over 3 seconds |
| Cutting perceived wait times by 40% grew signups by 15% |
Read those figures together and a pattern emerges. Speed is not a linear dial where a little faster earns a little more. The gains cluster hardest in the first few seconds, exactly the window where most visitors decide whether to stay. A site sitting at four seconds is not slightly behind a two second site. It is losing a large slice of traffic before those people ever see a product.
The relationship between website speed and revenue also stacks with everything else you spend money on. Paid traffic, SEO, email campaigns, influencer deals, all of it funnels into pages that either convert or leak. Speeding up the destination raises the return on every acquisition channel at once, which is why it tends to be one of the highest leverage investments a growing business can make.
The Psychology Behind Why Speed Sells
The data is convincing, but it helps to understand the mechanism. People do not consciously time your pages with a stopwatch. They feel friction, and friction erodes intent.
Research on human perception puts a few thresholds worth knowing. Under 100 milliseconds feels instant. Up to about one second keeps a user in flow, aware of the delay but not distracted by it. Past roughly three seconds, attention starts to fracture and doubt creeps in. By the time a page drags toward ten seconds, most people have mentally left, even if the tab is still open.
Slowness also carries a signal. A sluggish checkout reads as untrustworthy, especially when someone is about to enter a card number. Shoppers cannot inspect your backend security, so they judge competence by proxy, and a spinning loader is a poor proxy to offer. Fast, responsive interfaces feel maintained and safe. That perception directly influences whether a hesitant buyer completes the purchase or bails to a competitor.
The Metrics That Connect Website Speed and Revenue
You cannot manage what you do not measure, and "the site feels slow" is not a metric. A handful of numbers actually track the money.
Largest Contentful Paint (LCP). This measures when the main content of a page becomes visible. It maps closely to the moment a visitor believes the page is usable. Google wants this under 2.5 seconds, and for good reason: LCP correlates tightly with bounce rate on landing pages.
Interaction to Next Paint (INP). This captures how quickly the page responds when someone taps, clicks, or types. Sluggish responses during checkout or search are conversion killers because they arrive at the exact moment a user is trying to give you money.
Time to First Byte (TTFB). This is the server side portion, how long your backend takes to start sending the page. A slow TTFB poisons everything downstream, because nothing on the client can start until the first bytes arrive.
Cumulative Layout Shift (CLS). This measures visual stability. Buttons that jump as the page loads cause misclicks and frustration, and a mistap on "buy now" that lands on an ad instead is a lost sale.
The trap here is optimizing lab scores instead of field data. Lighthouse runs on simulated hardware in a clean room. Your customers are on three year old phones, spotty mobile networks, and browsers stuffed with extensions. Always weight the field data from real users, available through the Chrome User Experience Report and Google Search Console, above any single lab run.
How to Measure Website Speed and Revenue on Your Own Site
Industry averages are motivating, but your board wants your numbers. The good news is that the tools to prove the connection on your own property are free or close to it.
Start by segmenting your analytics by load performance. In most analytics platforms you can capture a performance metric alongside each session and compare conversion rates across speed buckets. If you send Web Vitals to your analytics, the query becomes straightforward: group sessions by LCP band and look at conversion rate for each.
import { onLCP, onINP, onCLS } from "web-vitals";

function report(metric) {
  // Attach the vital to the session so it can be
  // cross referenced with conversion events later.
  analytics.track("web_vital", {
    name: metric.name,
    value: Math.round(metric.value),
    rating: metric.rating,
    path: window.location.pathname,
  });
}

onLCP(report);
onINP(report);
onCLS(report);
Once a few weeks of data lands, build a simple table: sessions where LCP was under 2.5 seconds versus 2.5 to 4 seconds versus over 4 seconds, with the conversion rate for each band. On nearly every site that runs this analysis, the fast band converts materially better. That single table is the most persuasive artifact you can bring to a budget conversation, because it turns website speed and revenue from a blog statistic into your own profit and loss line.
For a rough dollar estimate, multiply your monthly sessions by the conversion lift you would expect from moving slow sessions into the fast band, then by your average order value. Even a conservative one point gain often clears six figures a year for a mid sized store.
Fixing the Bottlenecks That Cost You Money
Measurement points at the problem. Here is where the fixes usually pay off, roughly in order of impact.
Ship Less JavaScript
Oversized JavaScript bundles are the most common cause of slow interactivity. Every kilobyte has to be downloaded, parsed, and executed on the main thread, and on mid range phones that work is brutally slow. Audit your bundle, remove dependencies you no longer use, and lazy load anything not needed for the first paint.
import dynamic from "next/dynamic";

// Load the reviews widget only when it is actually needed,
// keeping it out of the critical path.
const ReviewsWidget = dynamic(() => import("@/components/ReviewsWidget"), {
  ssr: false,
  loading: () => null,
});
Render Above the Fold Content on the Server
Client rendered pages make the visitor wait for JavaScript before anything meaningful appears. Rendering the hero, headline, and primary call to action on the server means content shows up in the first response, which is the single biggest lever on LCP for most sites.
Fix Your Images
Images are still the heaviest thing on a typical page. Serve modern formats like AVIF and WebP, size them to the device rather than the source resolution, and preload only the one hero image that counts. A product grid pulling full resolution photos into thumbnail slots can waste megabytes per view.
Cache Aggressively and Move Work to the Edge
A slow TTFB usually means the server is doing too much per request. Cache rendered pages and API responses where you can, and push static and cacheable content to a CDN so it is served from a location near the user instead of a single origin halfway around the world.
Cut Third Party Scripts
Chat widgets, analytics, heat maps, ad pixels, and marketing tags each add weight and often block the main thread. Audit them ruthlessly. Every tag should justify its cost in performance, and load the survivors after the page is interactive rather than in the head.
Building the Business Case
Engineers rarely struggle to find performance work. They struggle to get it prioritized against the next feature. The way through is to frame the project in the language finance uses.
Take your measured conversion gap between fast and slow sessions, apply it to your traffic and average order value, and present an annual revenue figure. Set that against the engineering time required. Performance work is unusual in that the payback is often measured in weeks, and the gains keep accruing long after the work ships because faster pages lift every future campaign too.
It also compounds with search. Core Web Vitals are a genuine ranking signal, so a faster site earns more organic traffic on top of converting the traffic it already has. That combination, higher rankings feeding better converting pages, is why website speed and revenue deserve a permanent line in the roadmap rather than an occasional cleanup sprint.
The mistake most teams make is treating speed as a one time project. Sites regress. A new marketing tag, an unoptimized image, a heavy dependency added in a rush, and the numbers drift back down. Put a performance budget in your build pipeline, alert on regressions, and review your field data monthly. Speed is a property you maintain, not a milestone you pass.
Frequently Asked Questions
How strong is the link between website speed and revenue really?
It is one of the best documented relationships in ecommerce. Independent studies from Amazon, Walmart, Deloitte, and Google all point the same direction: faster pages convert better, and the effect is largest in the first few seconds of load time. The exact magnitude varies by industry and audience, but the direction is consistent enough that you can treat it as a reliable rule and then measure your own multiplier.
What load time should I aim for?
Target a Largest Contentful Paint under 2.5 seconds on a mid range mobile device using a typical mobile connection, not on your office fiber. That threshold sits inside Google's "Good" range and lands under the point where abandonment climbs sharply. Faster is better, but crossing from slow into that band captures the bulk of the revenue gain.
Does speed matter more on mobile or desktop?
Mobile, by a wide margin. Mobile devices have weaker processors and less reliable connections, so slow pages hurt more there, and mobile is where most traffic lives for consumer sites. Google's own research found more than half of mobile visits are abandoned when a page takes longer than three seconds to load.
Will faster pages help my SEO as well as conversions?
Yes. Core Web Vitals are part of Google's page experience ranking signals, so improving them can lift your organic rankings while it lifts conversions. You benefit twice: more visitors arriving and a higher share of them buying.
How do I stop performance from regressing after we fix it?
Add a performance budget to your continuous integration pipeline so builds fail when a bundle grows or a key metric slips past a threshold. Monitor field data from real users every month, and treat any regression as a bug rather than a cosmetic issue. Maintenance is cheaper than a second rescue project.
Fast pages are not a vanity metric. They are one of the clearest, most repeatable ways to grow the money your site already has the traffic to earn. If you want a measured audit that ties website speed and revenue together for your specific store and a plan to close the gap, our web development team can find the bottlenecks and fix them.
Tags